Brelje 2018a — figs 5 & 6 reproduction
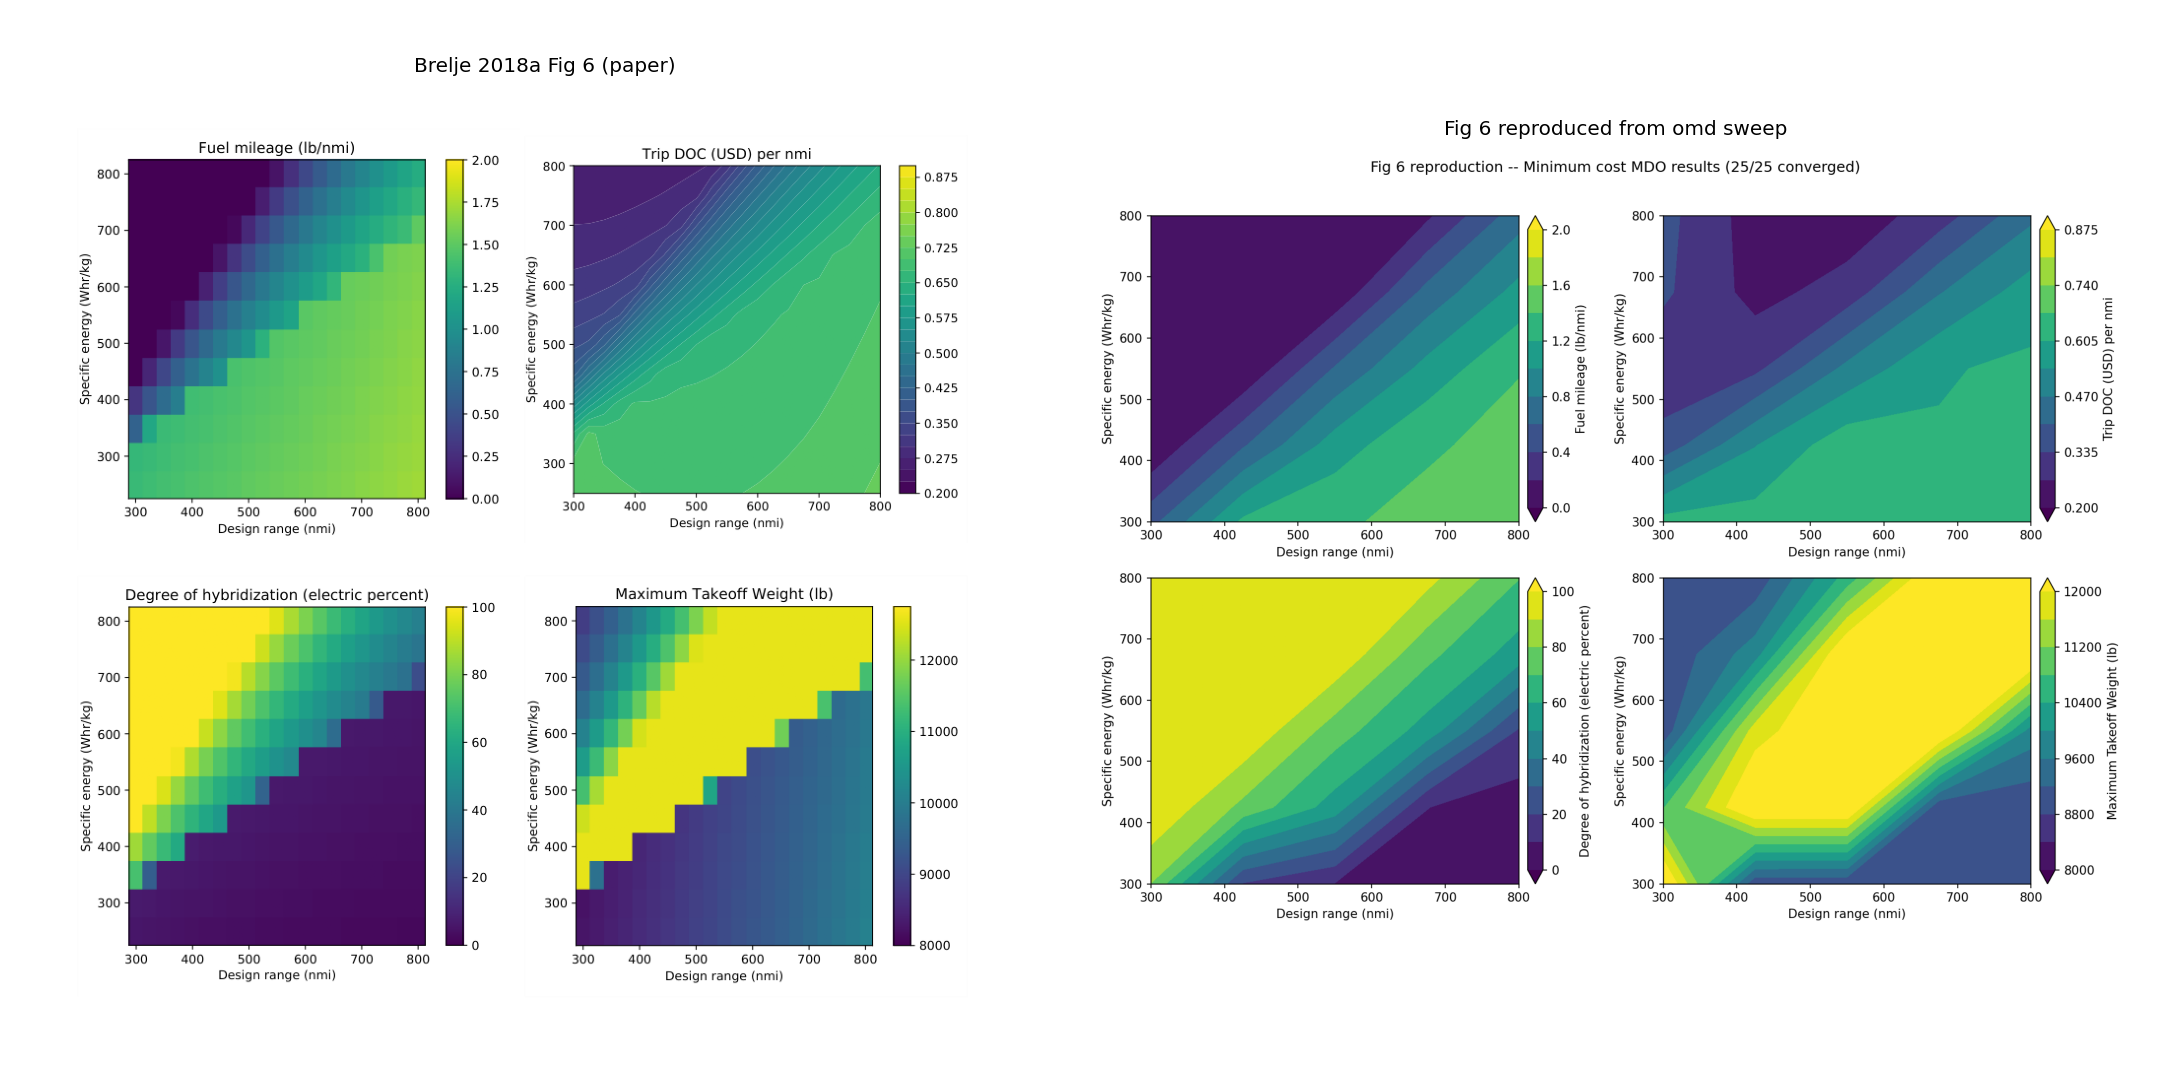
King Air C90GT twin series-hybrid MDO over mission range × battery specific energy. Each grid cell is an independent optimization. Fig 5 minimizes fuel + MTOW/100; Fig 6 minimizes trip direct operating cost. Run end-to-end through the hangar-omd Lane B plan pipeline.
Paper vs reproduced.
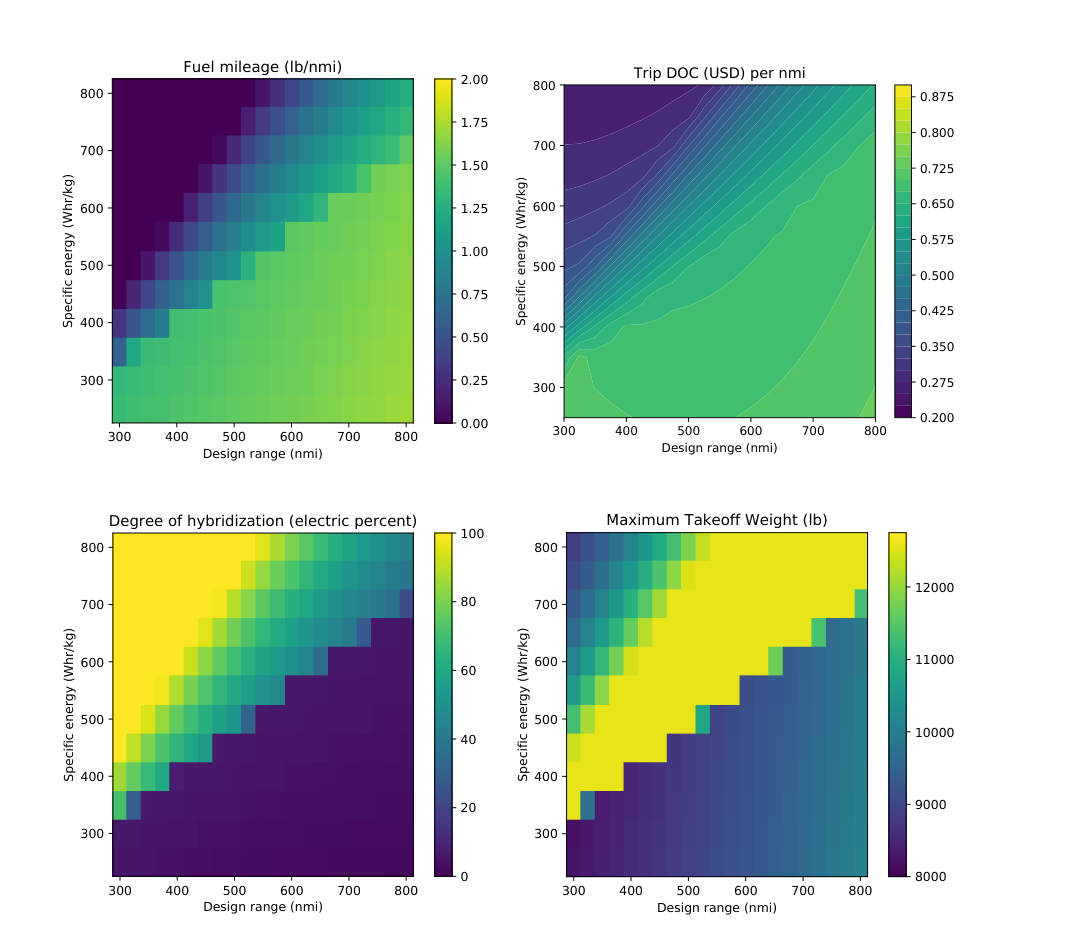
Figure 5 (fuel + MTOW/100 objective) contours over mission range and battery specific energy. Paper on the left, omd-run reproduction on the right.
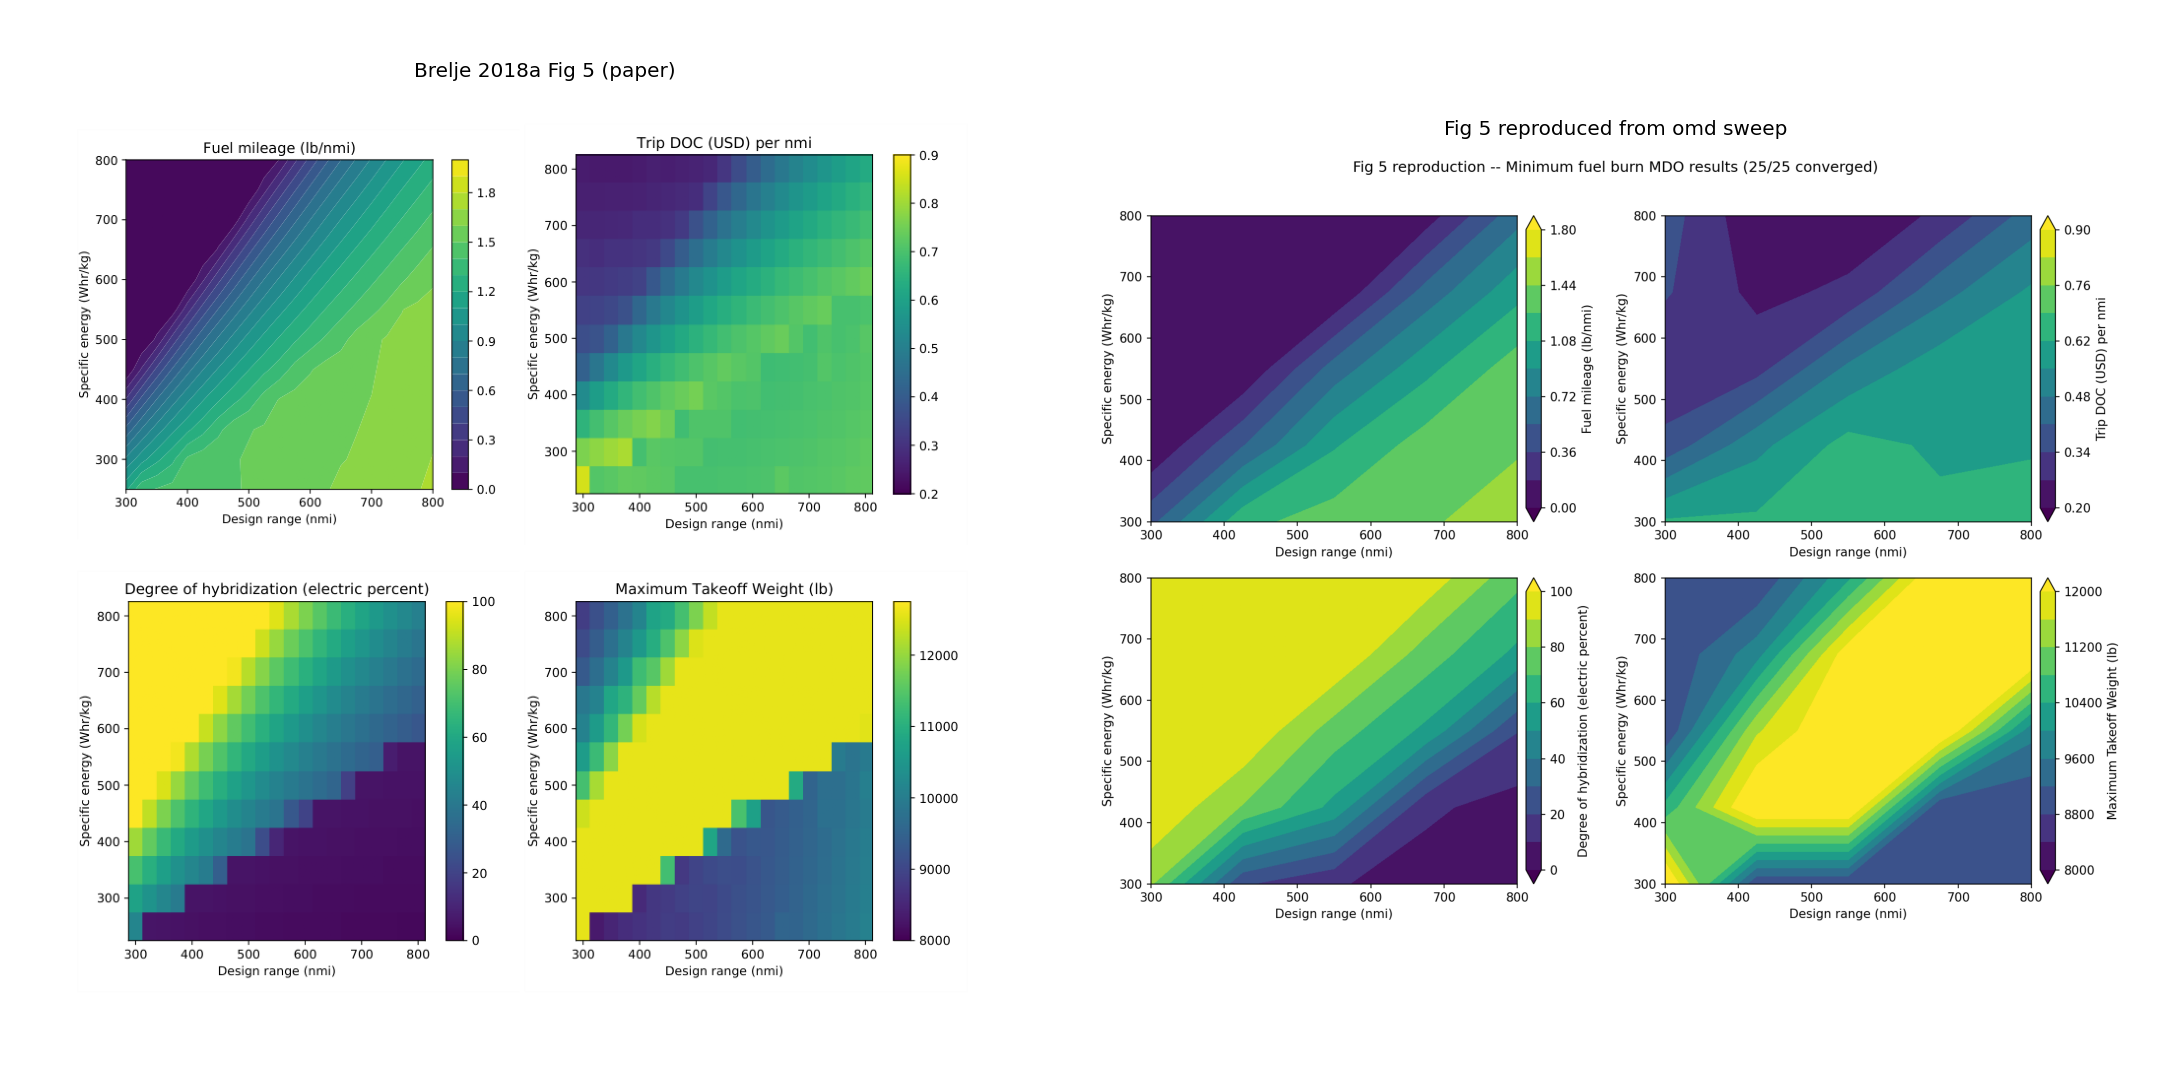
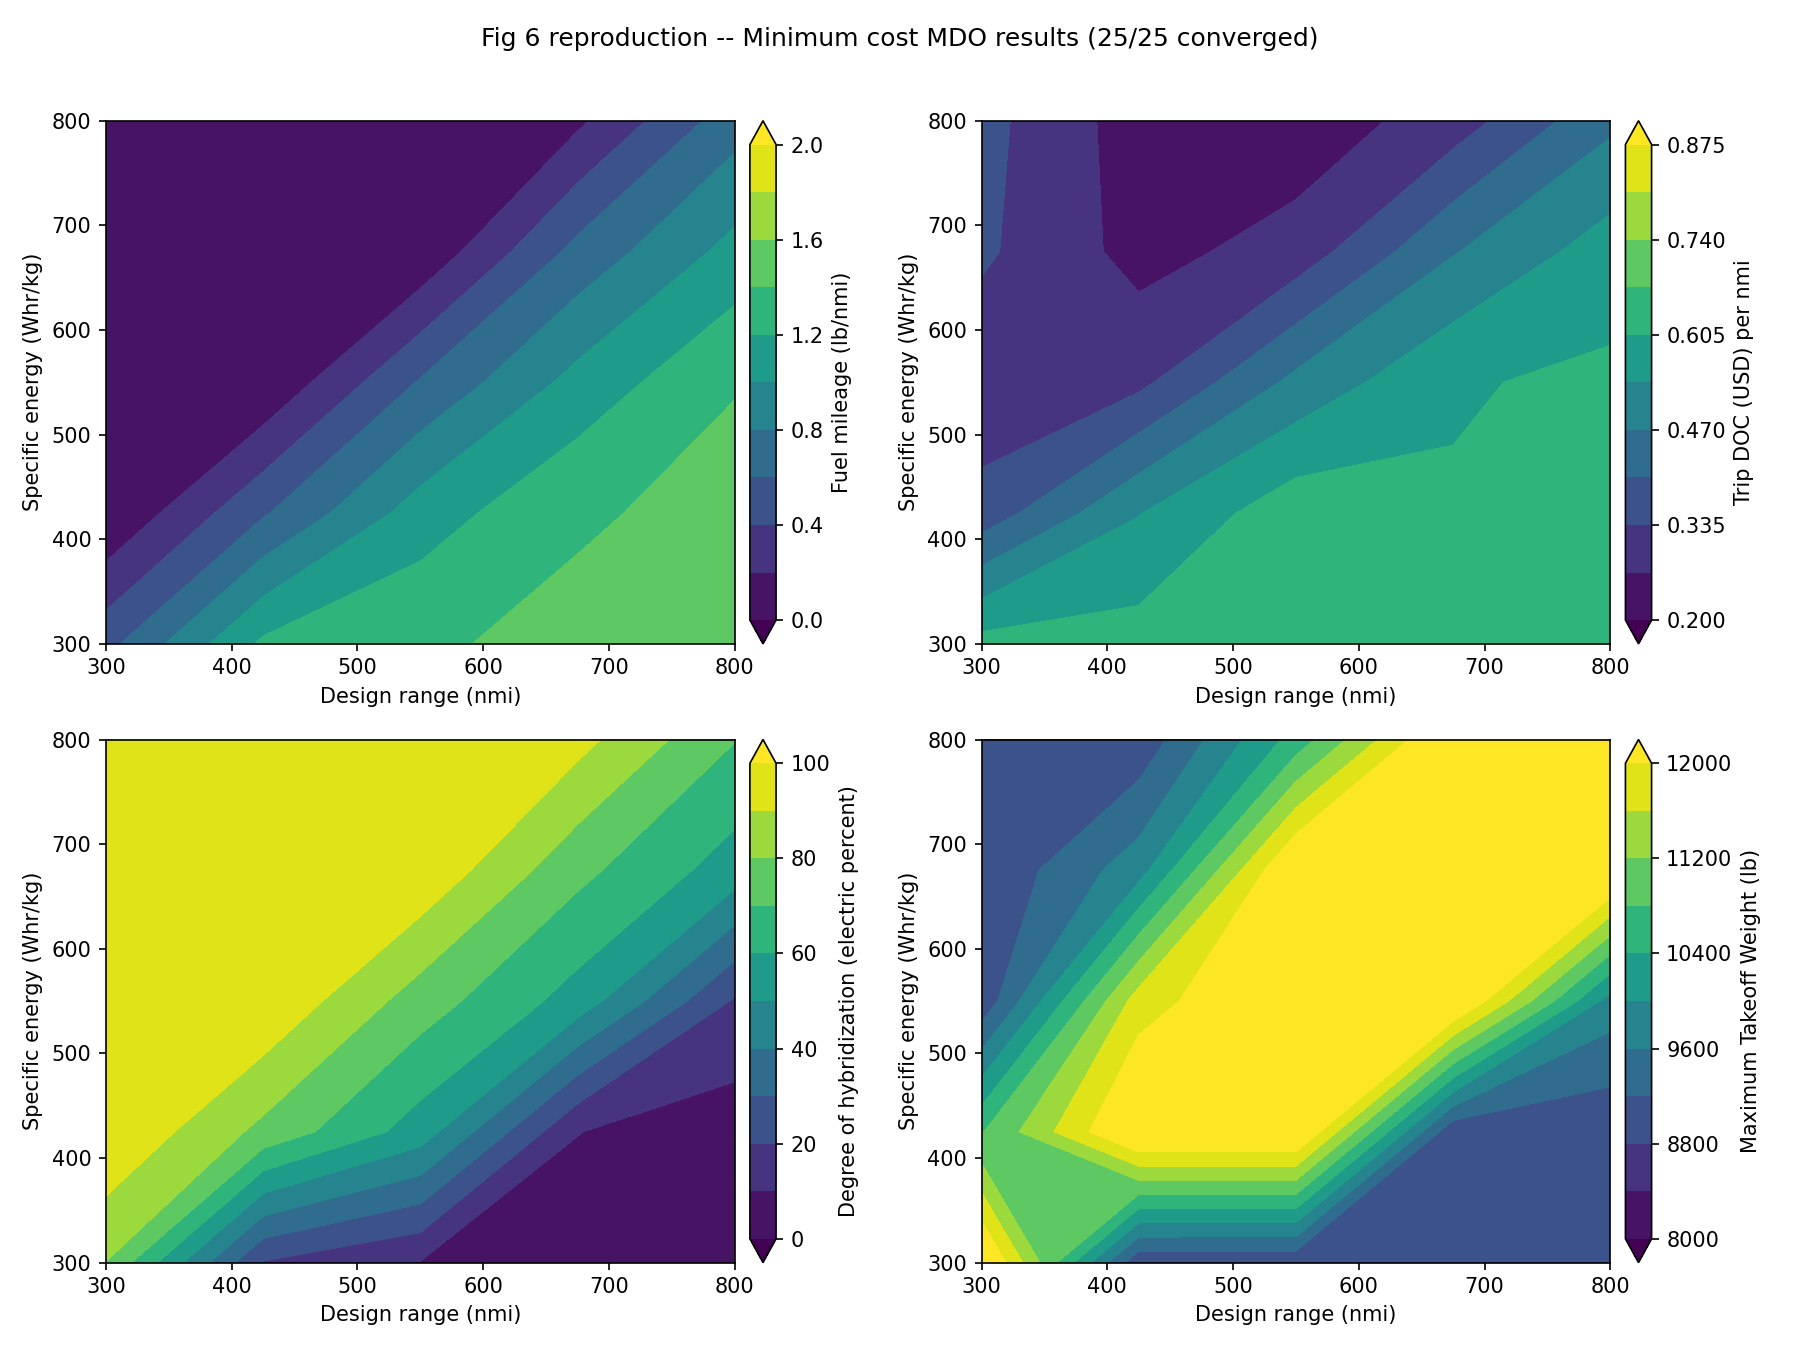
Figure 6 (trip direct operating cost objective). Cost MDO has competing local minima; each cell is warm-started from the fuel-optimized design at the same grid point.
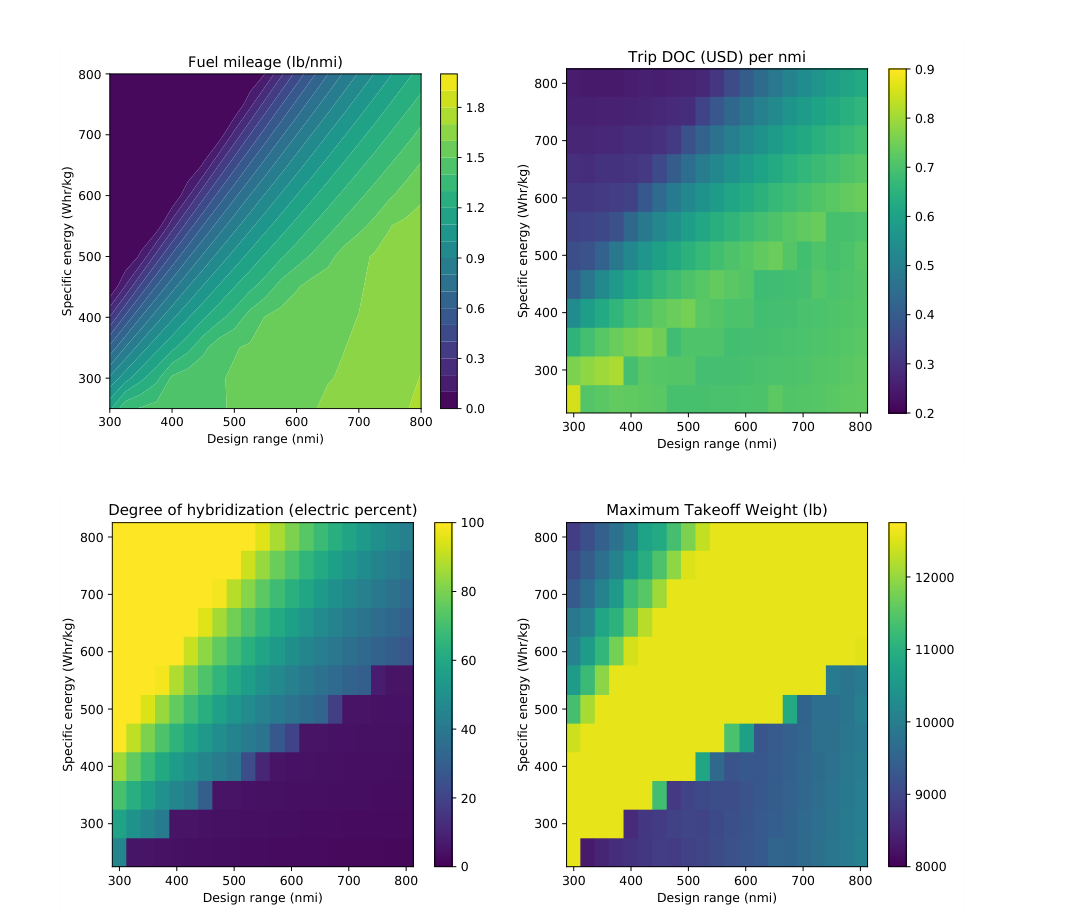
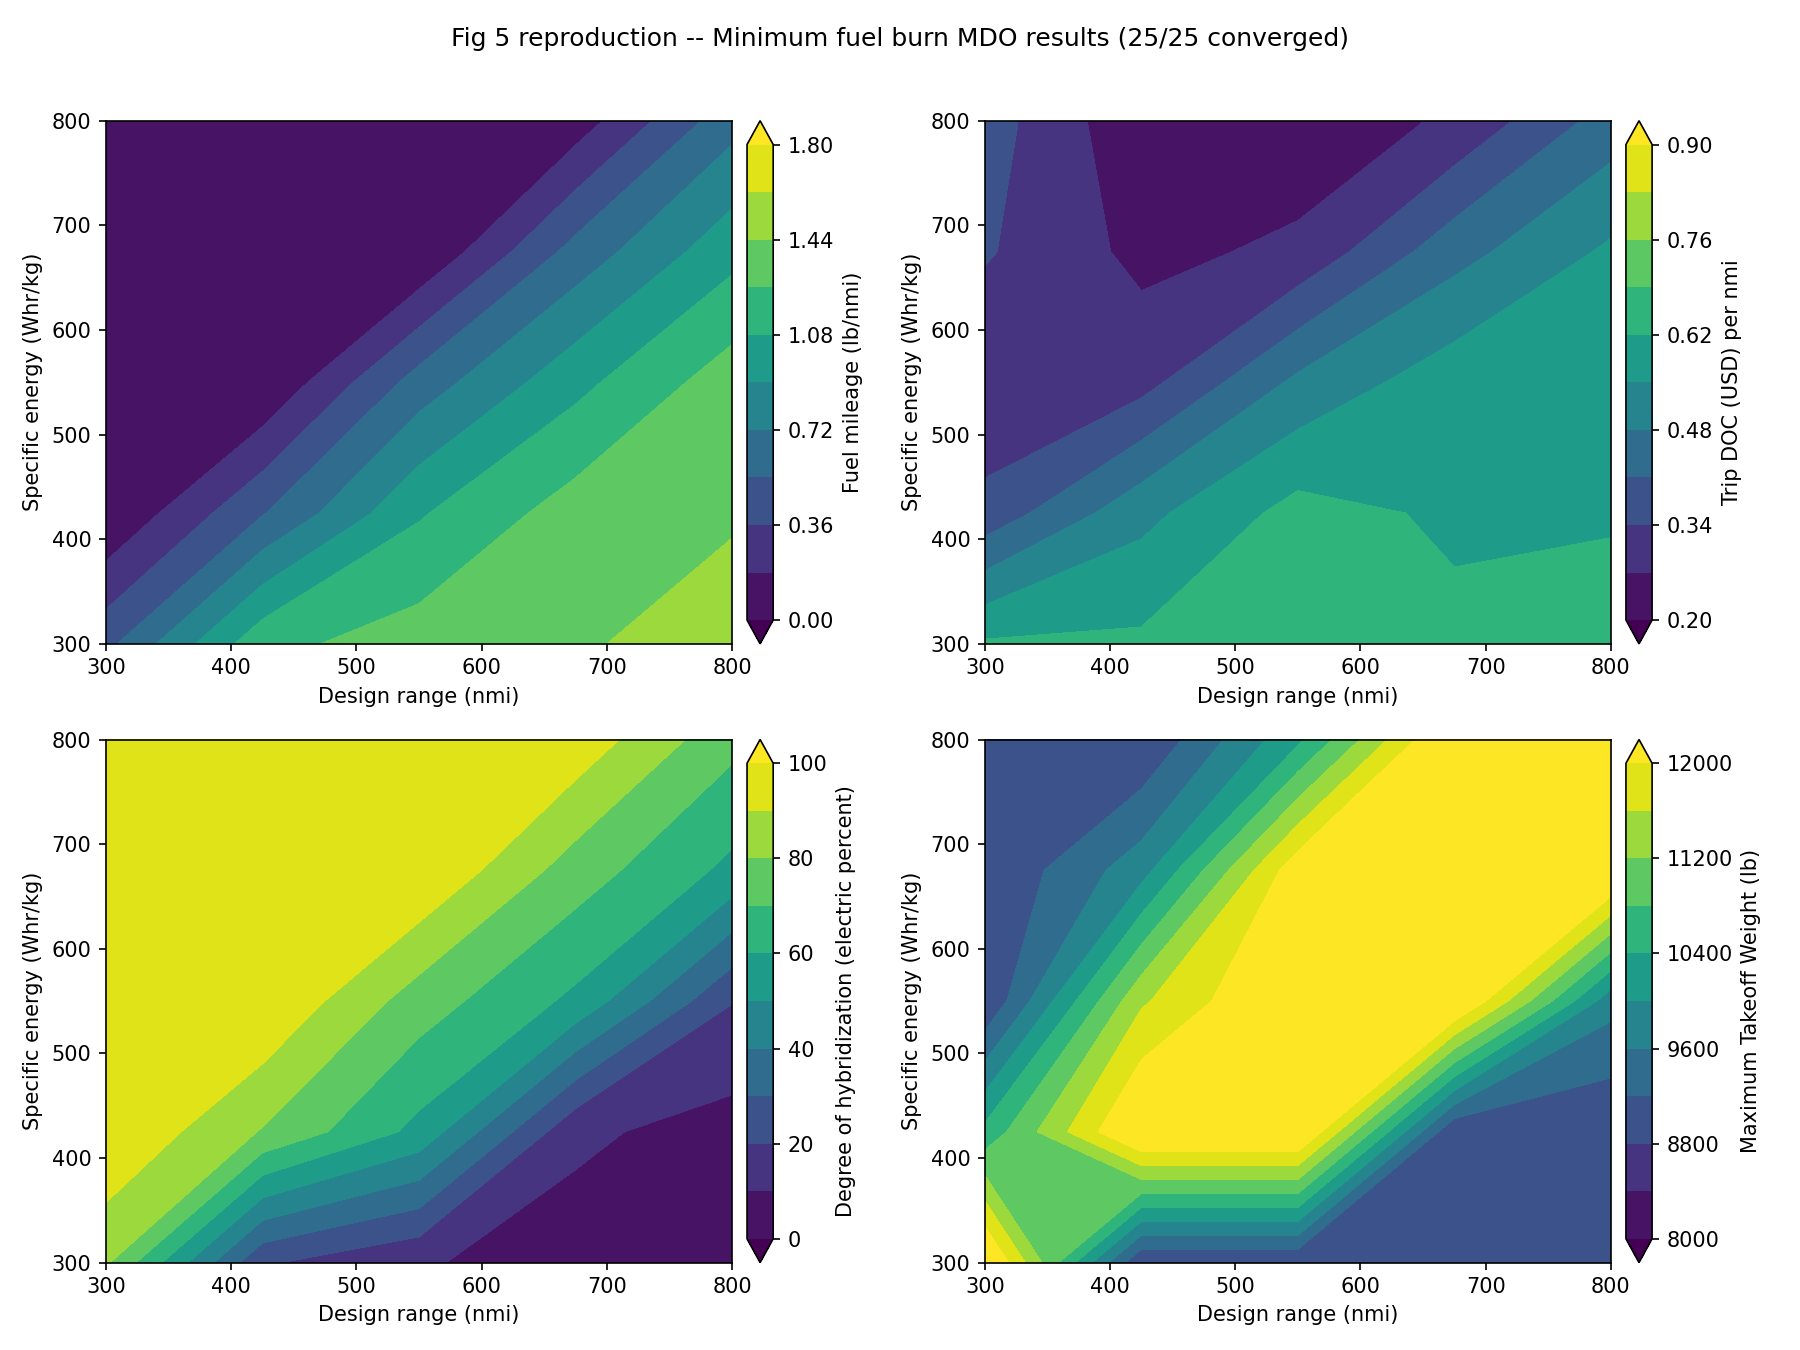
individual panels
Each figure on its own for closer inspection. All cropped consistently between paper and reproduction.
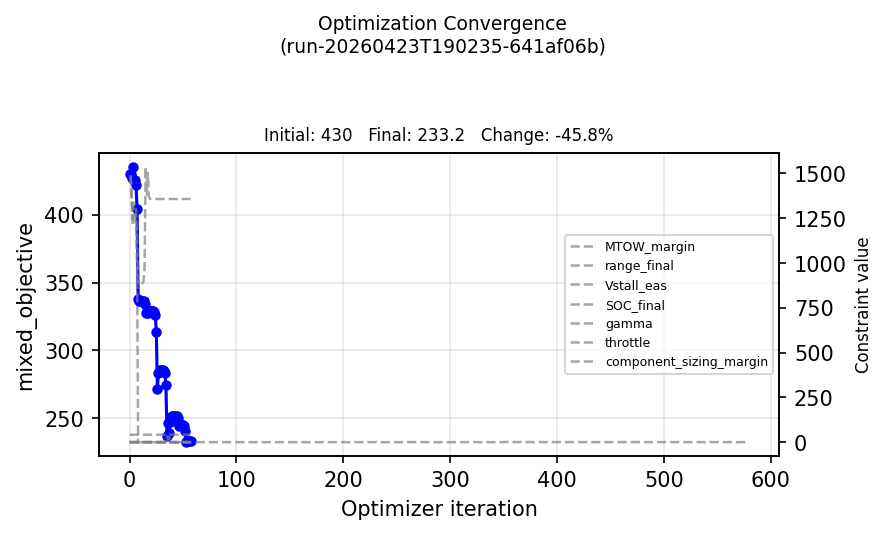
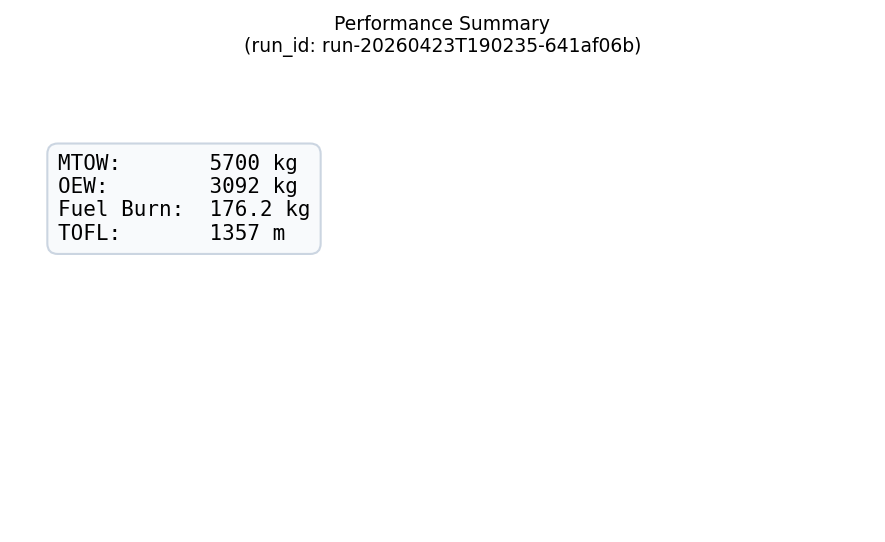
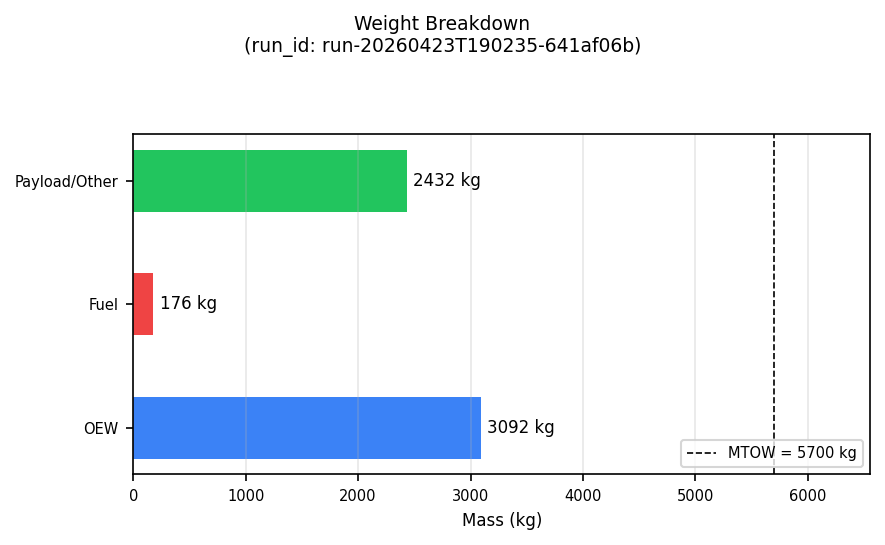
Lane-C run output.
Plots generated by omd-cli plot <run_id> --type all for the (500 nmi, 450 Wh/kg) headline cell. Read from the OpenMDAO recorder .sql for the converged run.
MDO problem setup.
Mission, DVs, constraints, and objective match upstream openconcept/examples/HybridTwin.py (lines 372-418) with the plan-level initial-value overrides warm-starting each grid cell.
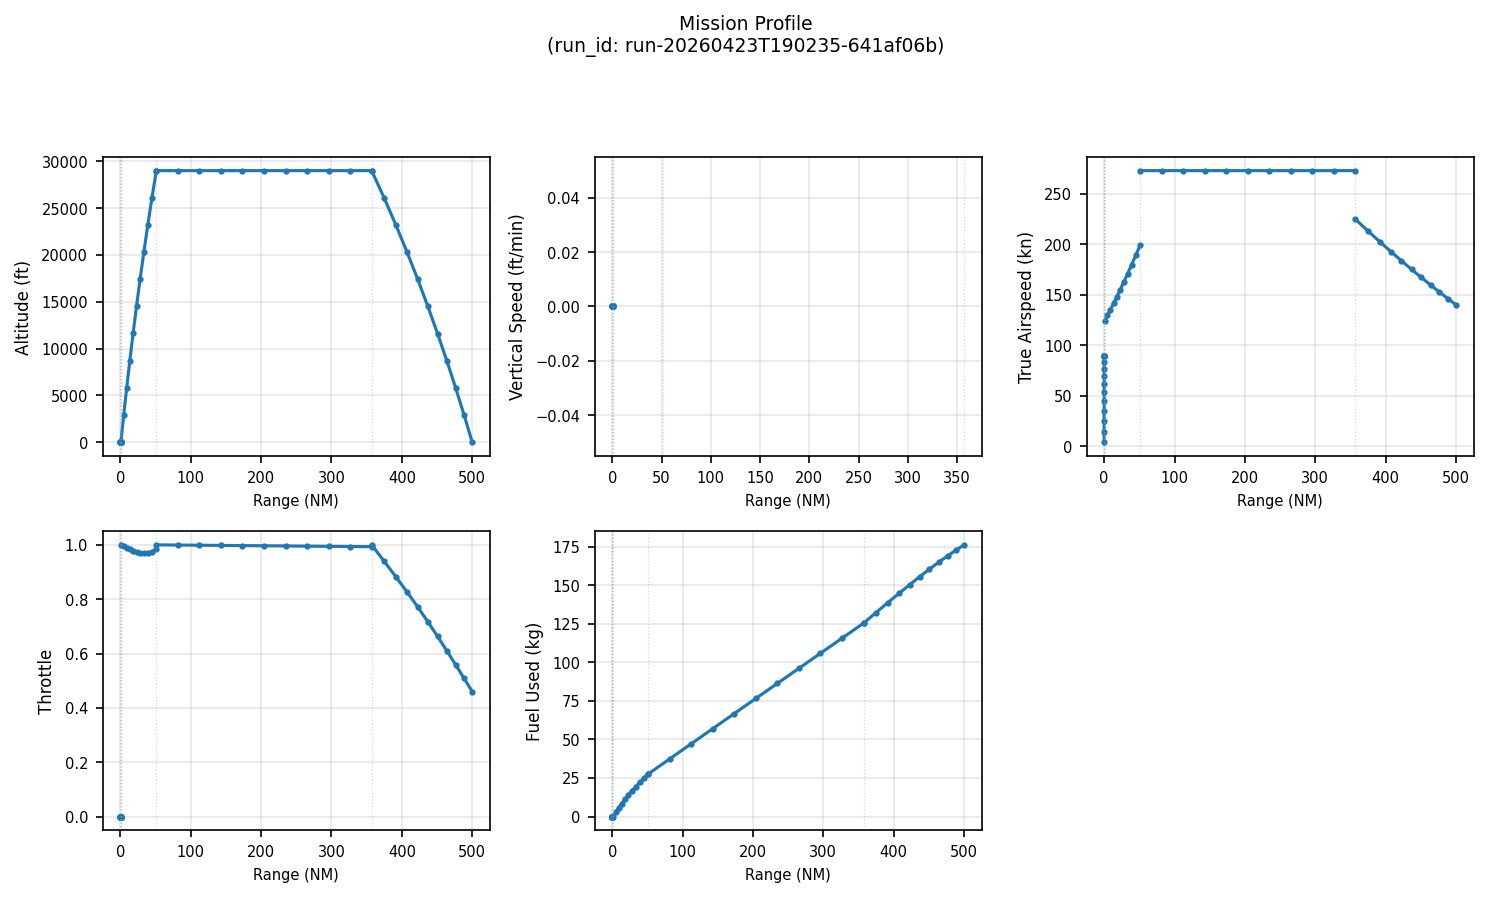
mission profile
| aircraft template | kingair (C90GT) |
| architecture | twin_series_hybrid |
| num_nodes | 11 (Simpson) |
| cruise altitude | 29,000 ft |
| mission range | 500 nmi (cell) |
| climb Veas | 124 kt @ 1500 fpm |
| cruise Veas | 170 kt |
| descent Veas | 140 kt @ -600 fpm |
| payload | 1000 lb |
| battery specific energy | 450 Wh/kg (cell) |
objective & optimizer
| objective (fig 5) | mixed_objective |
| objective (fig 6) | doc_per_nmi |
| optimizer | SLSQP |
| maxiter | 150 |
| tol | 1e-6 |
| nonlinear solver | Newton (inner) |
| linear solver | DirectSolver |
| atol / rtol | 1e-10 / 1e-10 |
design variables (10)
- ac|weights|MTOW [4000, 5700] kg
- ac|geom|wing|S_ref [15, 40] m²
- ac|propulsion|engine|rating [1, 3000] hp
- ac|propulsion|motor|rating [450, 3000] hp
- ac|propulsion|generator|rating [1, 3000] hp
- ac|weights|W_battery [20, 2250] kg
- ac|weights|W_fuel_max [500, 3000] kg
- cruise.hybridization [0.001, 0.999]
- climb.hybridization [0.001, 0.999]
- descent.hybridization [0.01, 1.0]
constraints (16 rows)
- MTOW_margin ≥ 0
- rotate.range_final ≤ 1357 m (BFL 4452 ft)
- v0v1.Vstall_eas ≤ 42 m/s (~81.6 kt)
- descent.SOC_final ≥ 0 (battery not over-drawn)
- engineoutclimb.gamma ≥ 0.02 (OEI climb gradient)
- climb.throttle ≤ 1.05
- component_sizing_margin ≤ 1 (eng1/gen1/batt1 x 4 phases = 11 rows)
Per-step decision log.
Every plan primitive (solver, DV bounds, constraint, objective, optimizer, result interpretation, convergence assessment) was recorded via omd-cli log-decision during interactive-builder assembly. Verbatim from plans/brelje-fuel-mdo-lane-c/decisions.yaml.
component_selection1 decision
solver_selection1 decision
dv_setup10 decisions
objective_selection1 decision
constraint_setup1 decision (16 constraint rows)
optimizer_selection1 decision
problem_definition1 decision
result_interpretation1 decision
convergence_assessment1 decision
Divergences from the paper.
Documented trade-offs where the reproduction departs from the published result.
where the reproduction differs
- grid resolution. The headline result uses 5×5 = 25 cells (~25 min wall time on 4 workers) rather than the paper's 21×12 = 252 cells (~3 h). The coarser grid blurs the hybrid/electric boundary but preserves all qualitative trends.
- convergence rate. The paper reports 1/252 failures. In the 5×5 fuel sweep, 6/25 cells exited with SLSQP mode 8 (KKT tolerance hit at a feasible optimum with all constraints active at bounds); those are post-processed to converged after a feasibility check, matching what the fuel grid contour plot renders. The cost sweep had 0/25 raw failures. Better per-cell starting guesses would likely close this gap.
- cost warm-starts. The cost objective has competing local minima; the template-default starting point converges at MTOW ~4400 kg, while warm-starting from the fuel-optimized design for the same grid cell finds the true minimum at or near MTOW = 5700 kg. The sweep is therefore run with
--warm-from fig5_grid.csvbefore plotting. - battery energy model. The reproduction approximates E_battery_used = 0.9 × W_battery × spec_energy; upstream OpenConcept integrates actual battery draw over the trajectory. Both use the $36/MWh coefficient for cost.
OpenMDAO model structure.
Interactive N2 matrix of the full problem, and the discipline-level problem graph showing analysis flow between components. Both are generated during packaging; locally they may 404 until package-case-study.sh extracts the artifacts.
N2 diagram
open full screen ->problem graph
open full screen ->W3C PROV-Agent graph & plan detail.
The provenance graph shows plan entities, decisions, run activities, and result assessments, with directed edges recording how each flowed into the next. The plan detail page renders the YAML plan with cross-links into the graph. Both are static renders of the live omd viewer.
provenance graph
open full screen ->plan detail
open full screen ->How to re-run this.
The full pipeline is ~45 minutes wall-time on a 4-worker machine. Single cells run in under a minute.